 FynSig
Find and describe even the smallest cells
FynSig specialises in computer vision and is based in Stellenbosch, South Africa. The name “FynSig” translates from Afrikaans as fine sight. Fittingly, our first product is an image-based flow cytometry platform that excels at finding and describing even the smallest of cells.
What makes us different
The first flow cytometry analysis platform powered by instance segmentation
Extract richer data
Every cell becomes its own object, with its own shape, size and texture — not just a point in a gate.
Discover more in analysis
Measurements you could not make before, on populations you could not separate before.
Get results faster
Automated where it used to be manual, so analysis stops being the thing you wait for.
Beta — Q2 2027
Struggling with a data backlog?
So were we, until we started optimising and automating. We are looking for early adopters of our beta, coming Q2 2027.
Yearly operating cost of a flow cytometry lab
Analysis takes twice as long as acquisition
Hours spent on analysis per year
Annual bioinformaticist wages spent on analysis
The platform
Built with images in mind
Our platform is designed specifically for imaging flow cytometry. Haven't upgraded yet and still using a conventional flow cytometer? No problem — it handles old-school flows just as well.
- Raw FileAny imaging flow cytometry image
- SegmentationInstance-level AI cell detection
- QuantificationRich image feature extraction & classification
- SignificanceBuilt-in statistical tests, ready for publication
Old flows welcome
Conventional, non-imaging cytometers are supported too. You do not need new hardware to start.
Machine learning built in
Find deeper relationships in your data and classify it, without leaving the platform. No tiers, no extra subscriptions.
Fast processing
Our model handles 600 images per second and is small enough to run on your laptop.
See for yourself
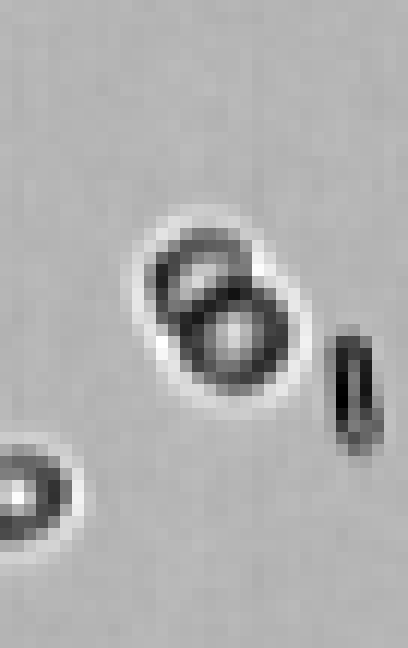
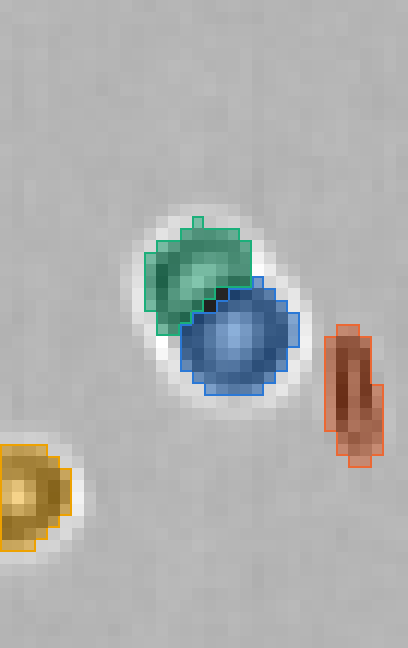
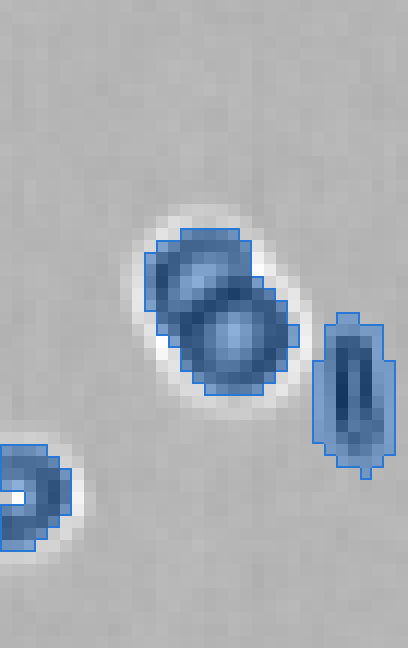
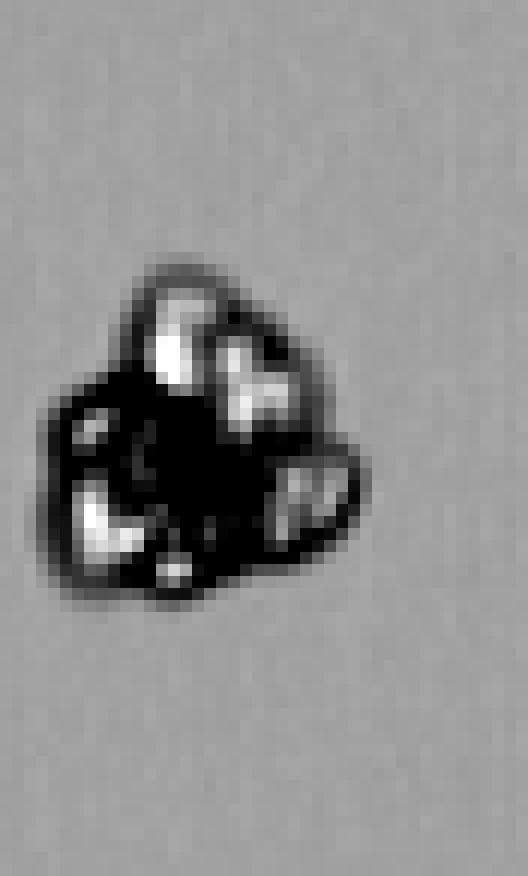
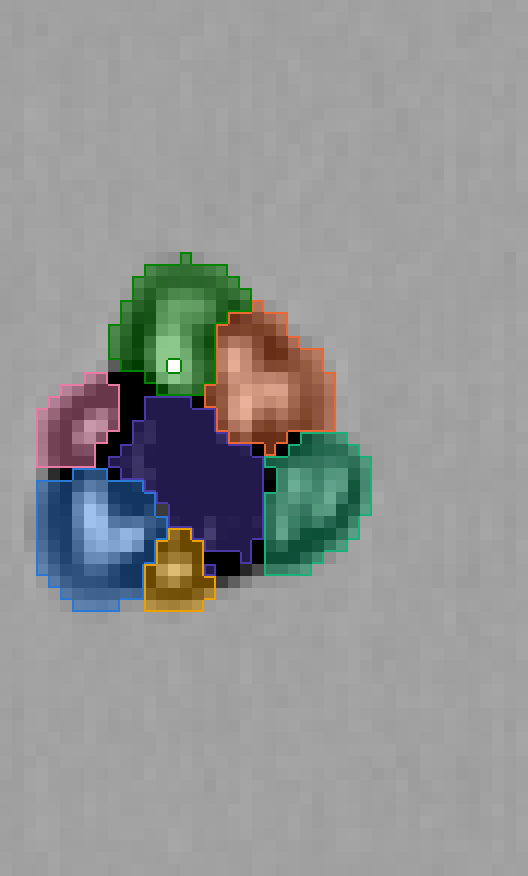
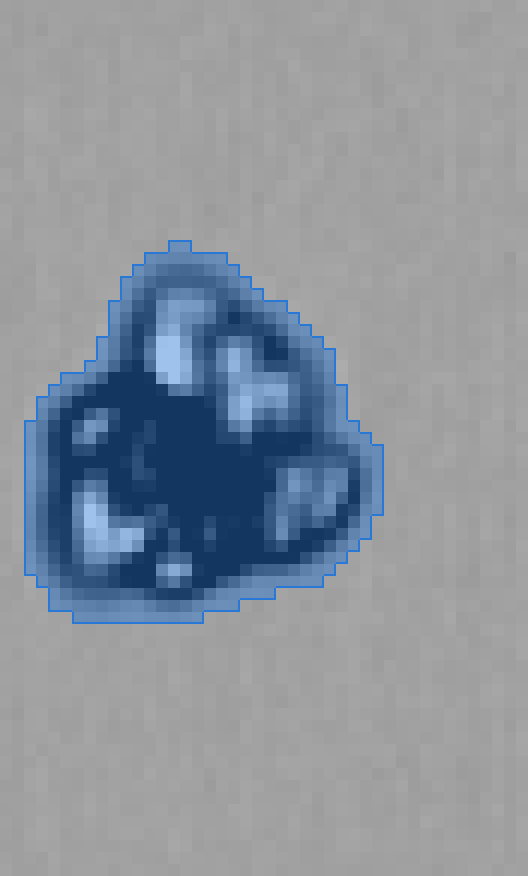
The images below contain blood cells captured on an imaging flow cytometer, view them three ways. To a machine each colour is one detected cell. Our model identifies each cell as its own entity, even when part of a clump.
Interact with data
The same 100 events are measured two ways. FynSig sees every cell as its own distinct entity. Drag the slider to switch between them, and point at any dot to see the cell behind it.
Contact us
Like what you see? Get in touch.
Tell us what you are trying to measure and what is slowing you down.
info@fynsig.com